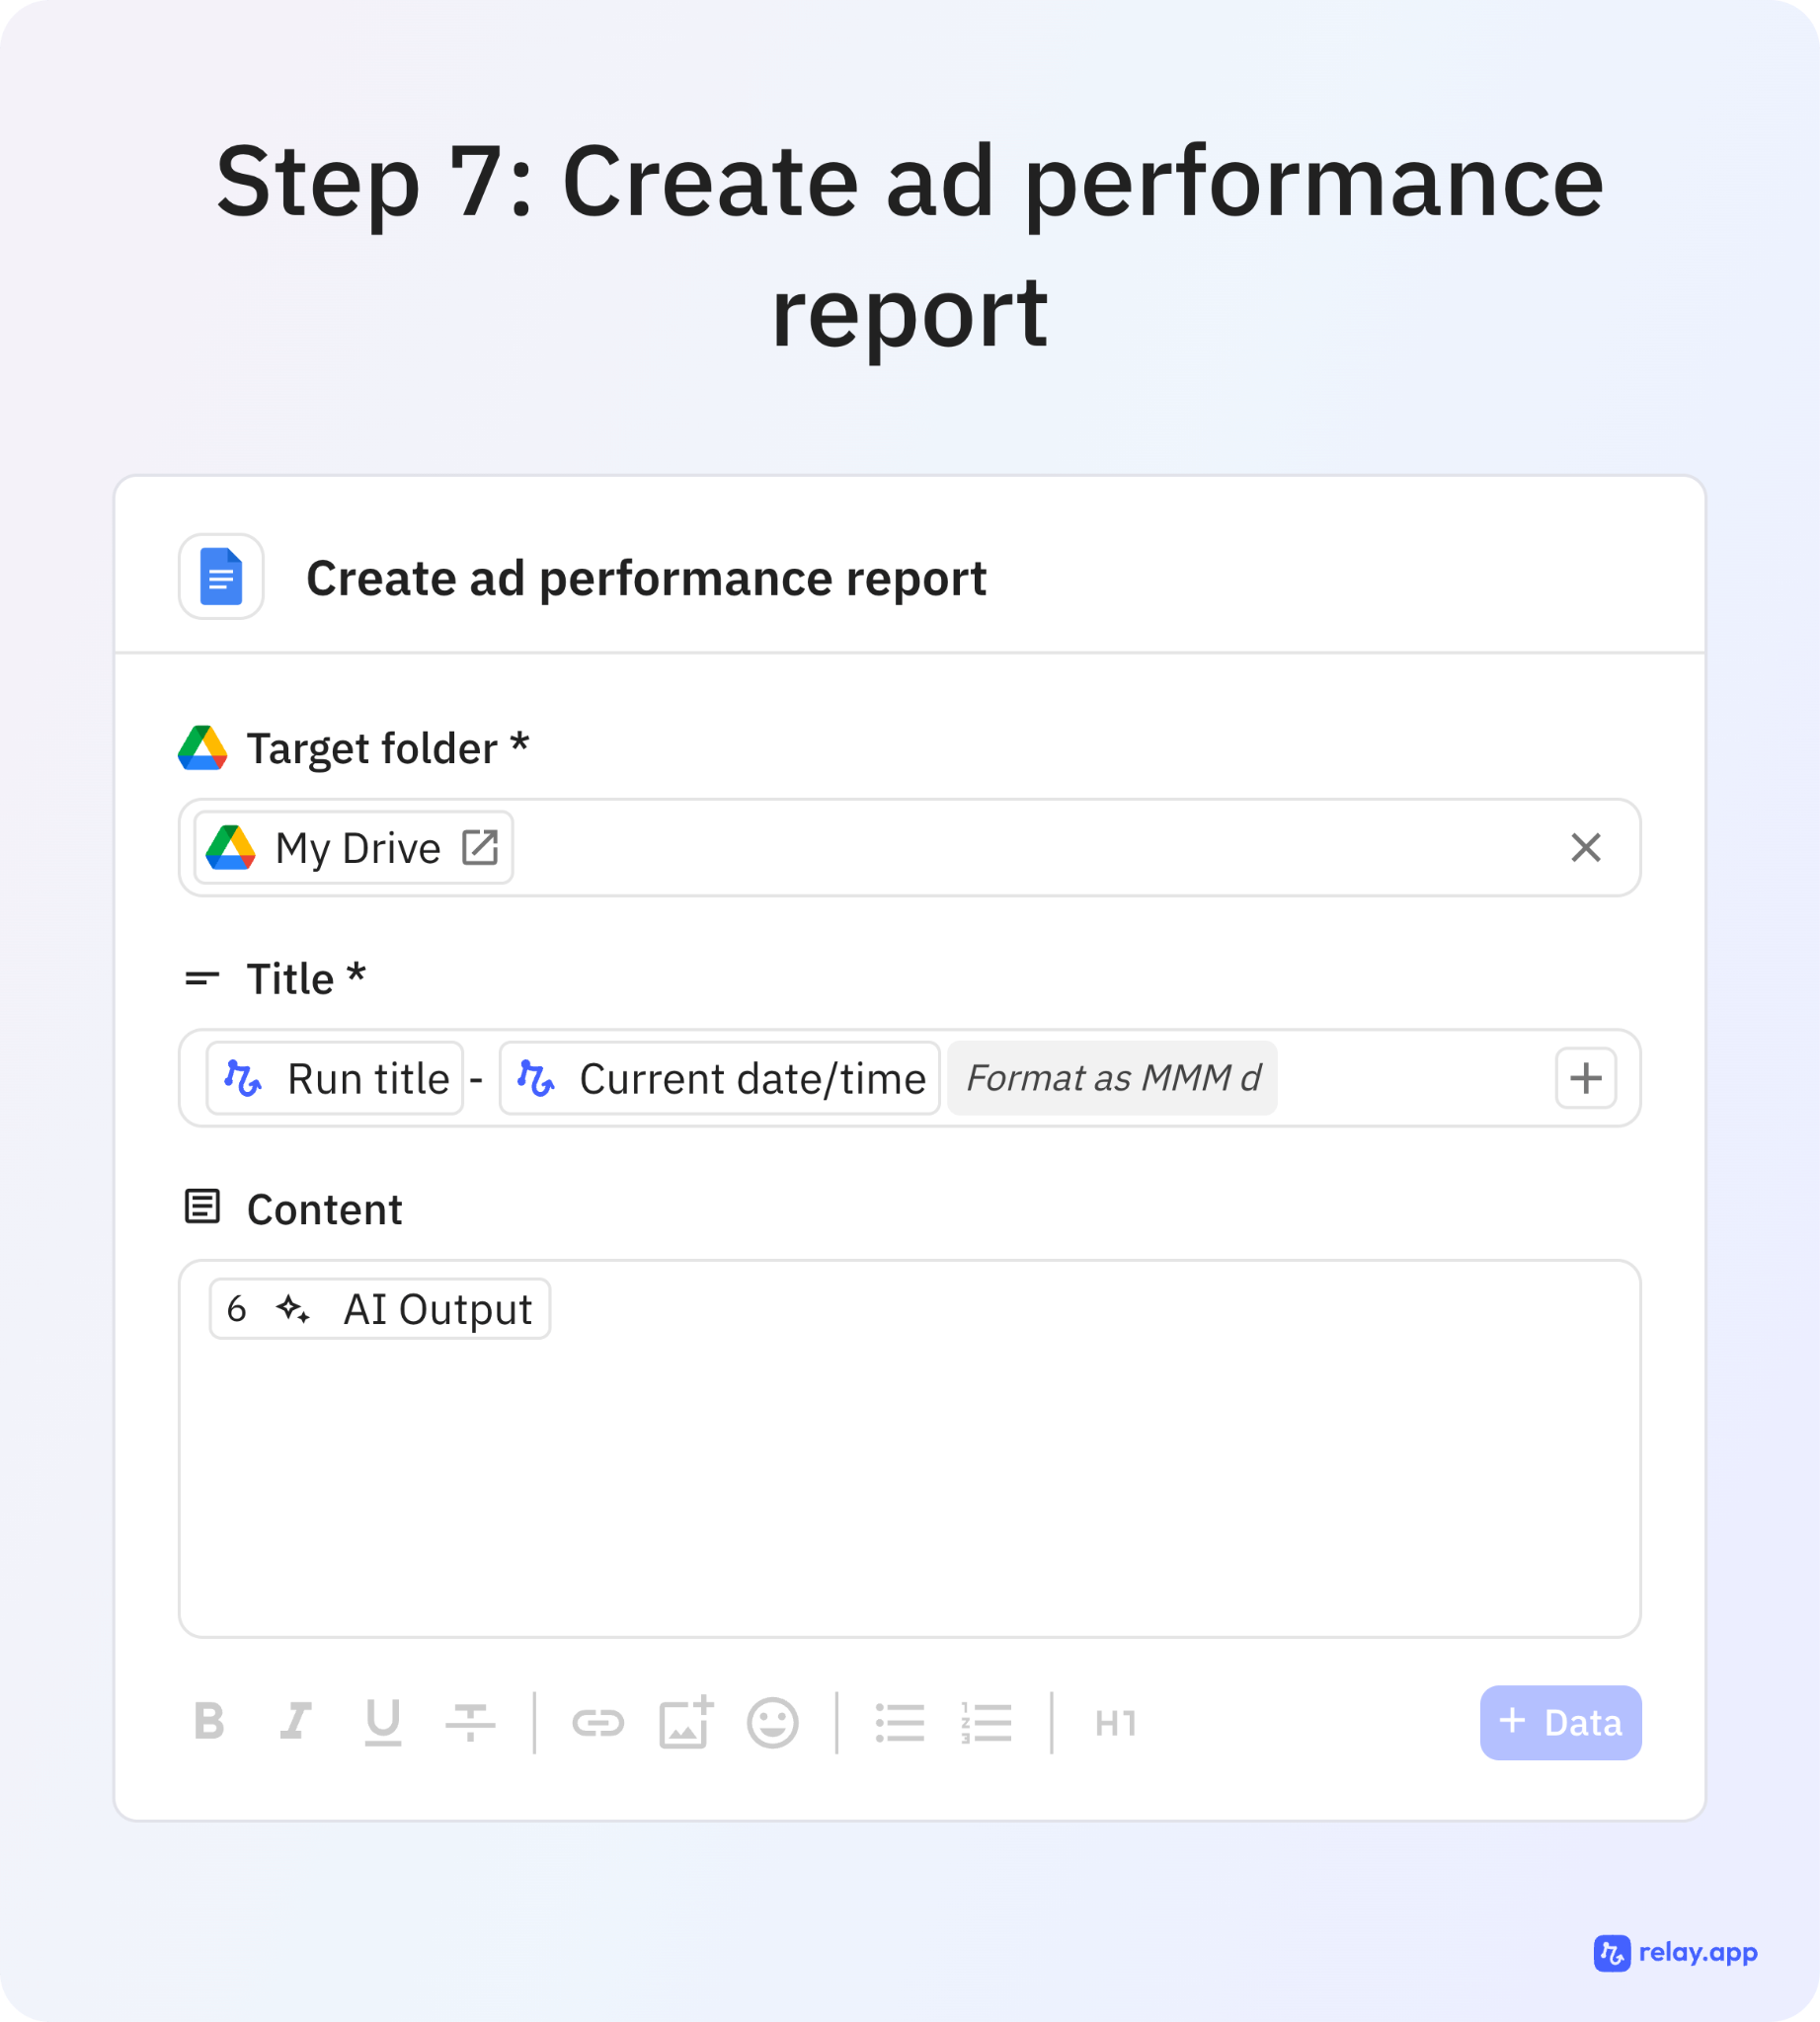
You’ll now build a table with rows and metrics.
Drag the following into the Rows area:
Drag the following into the Columns area:
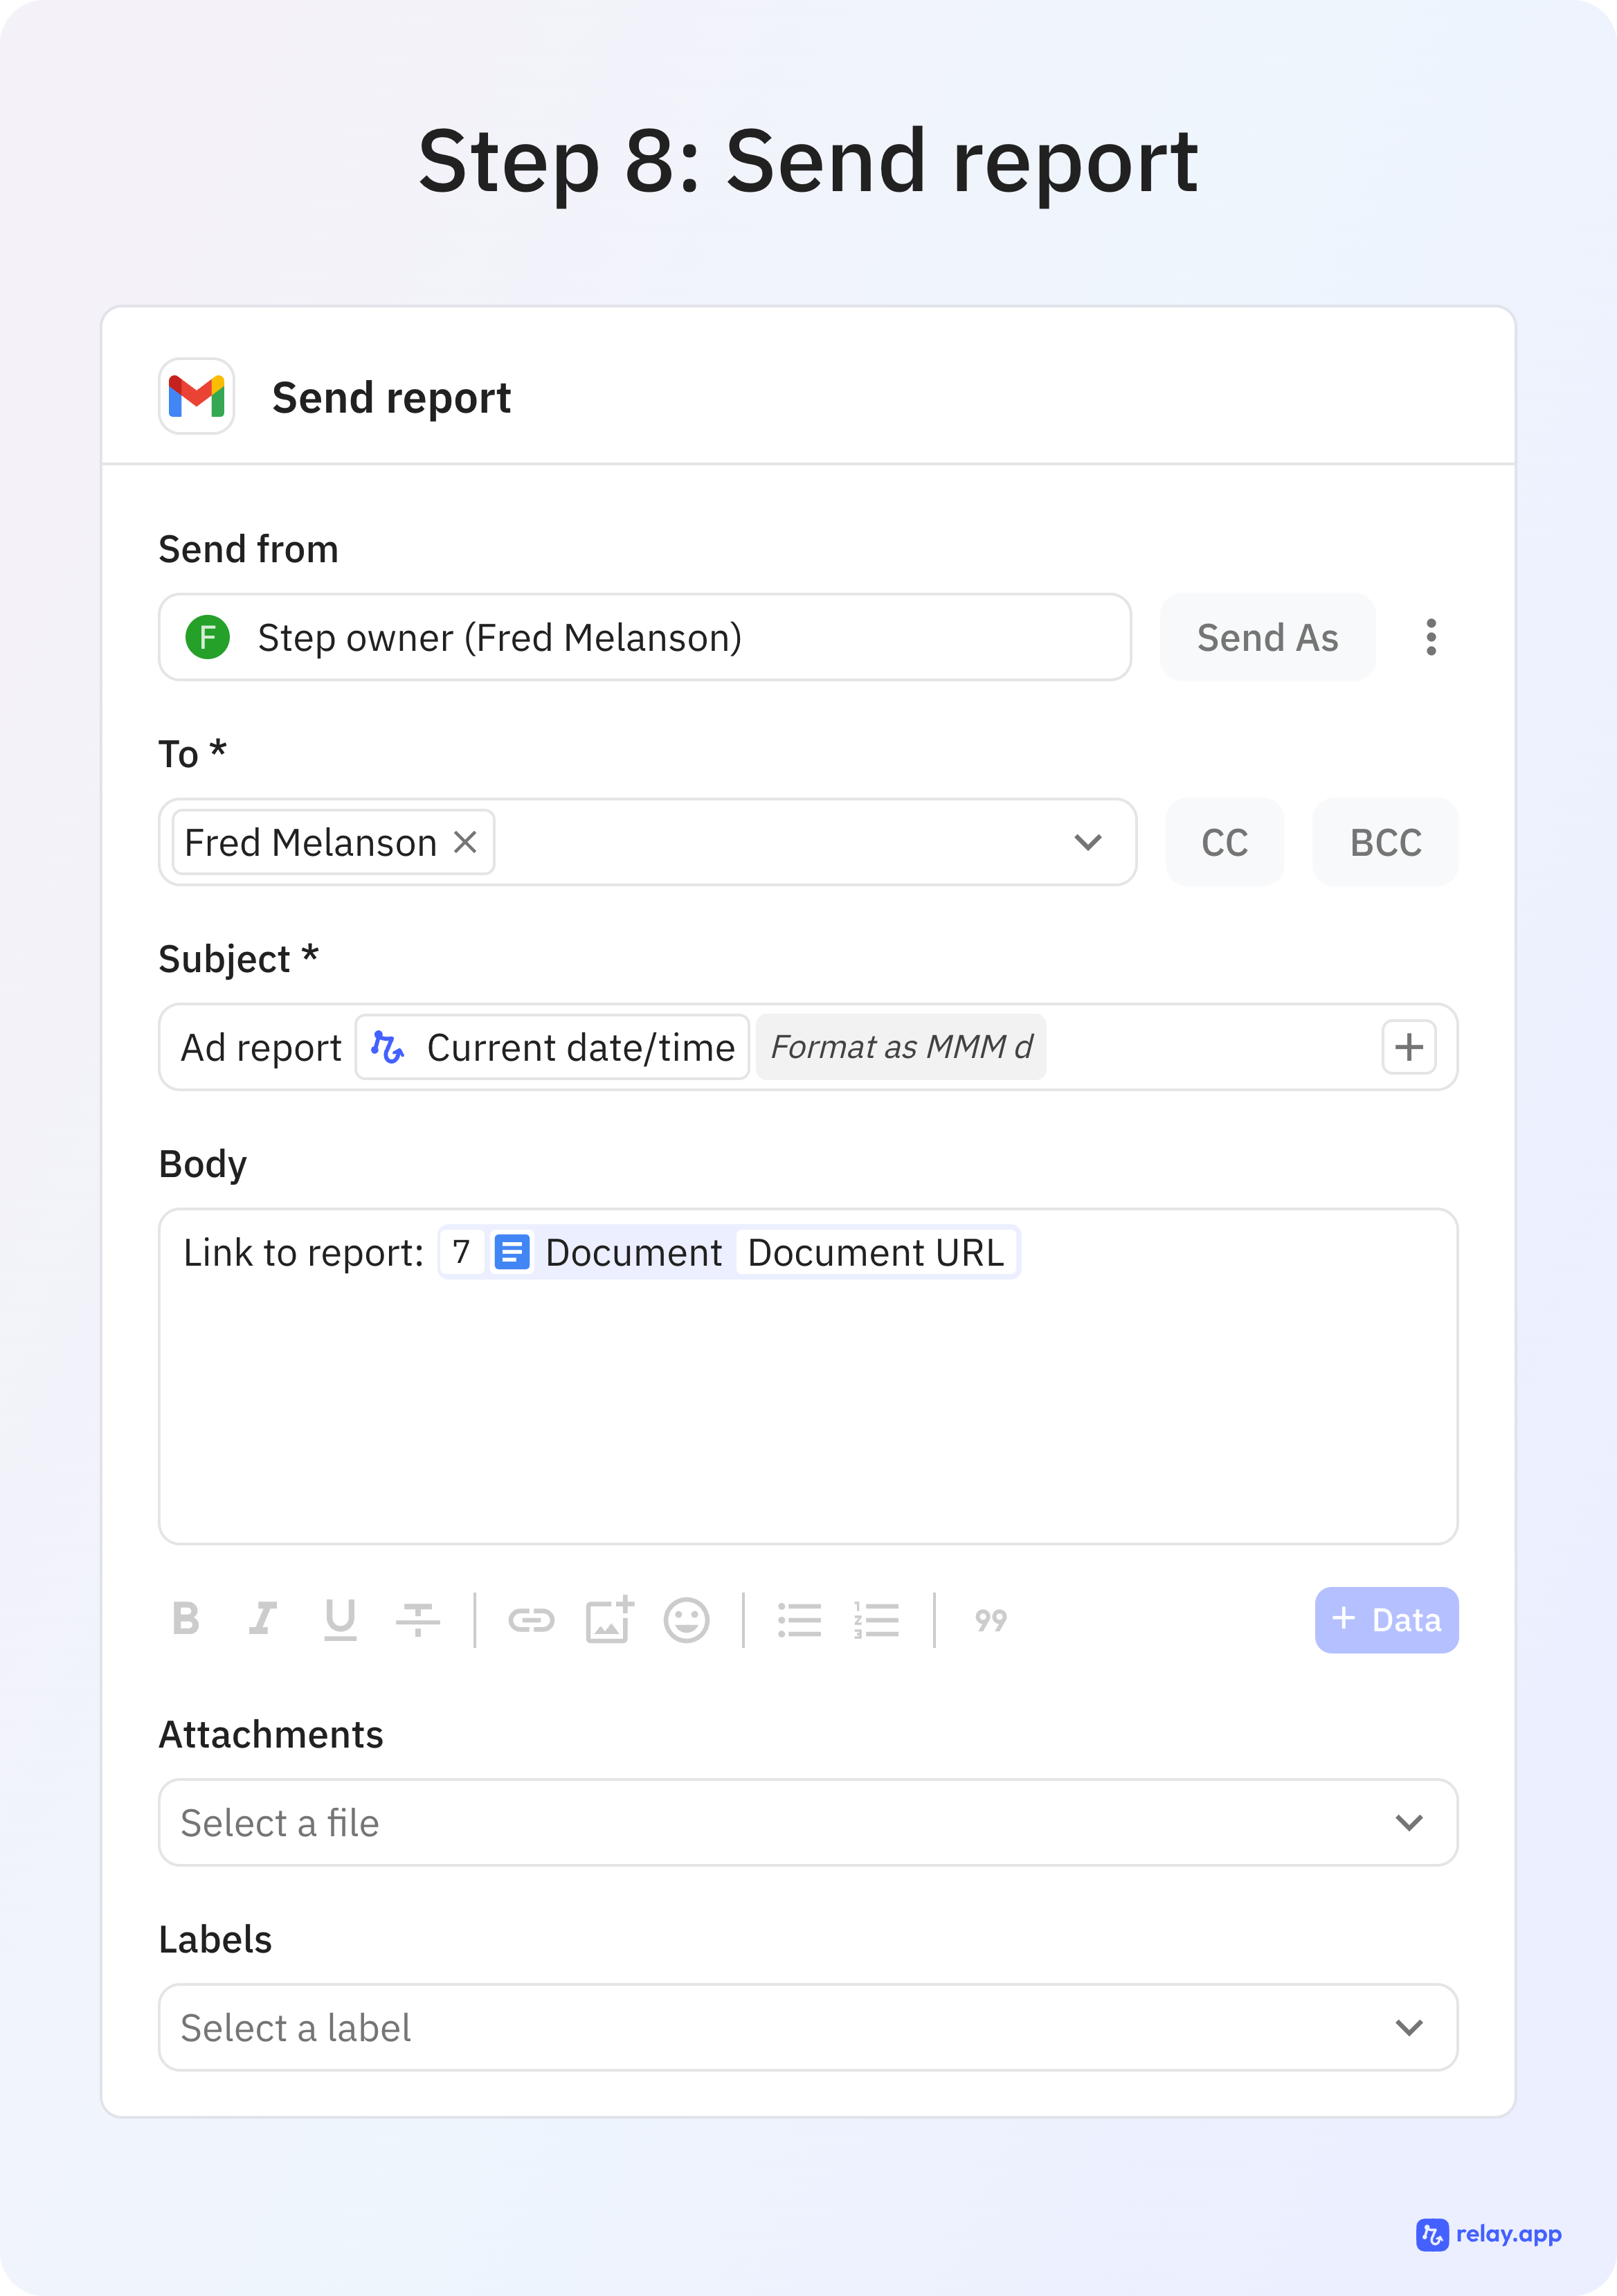
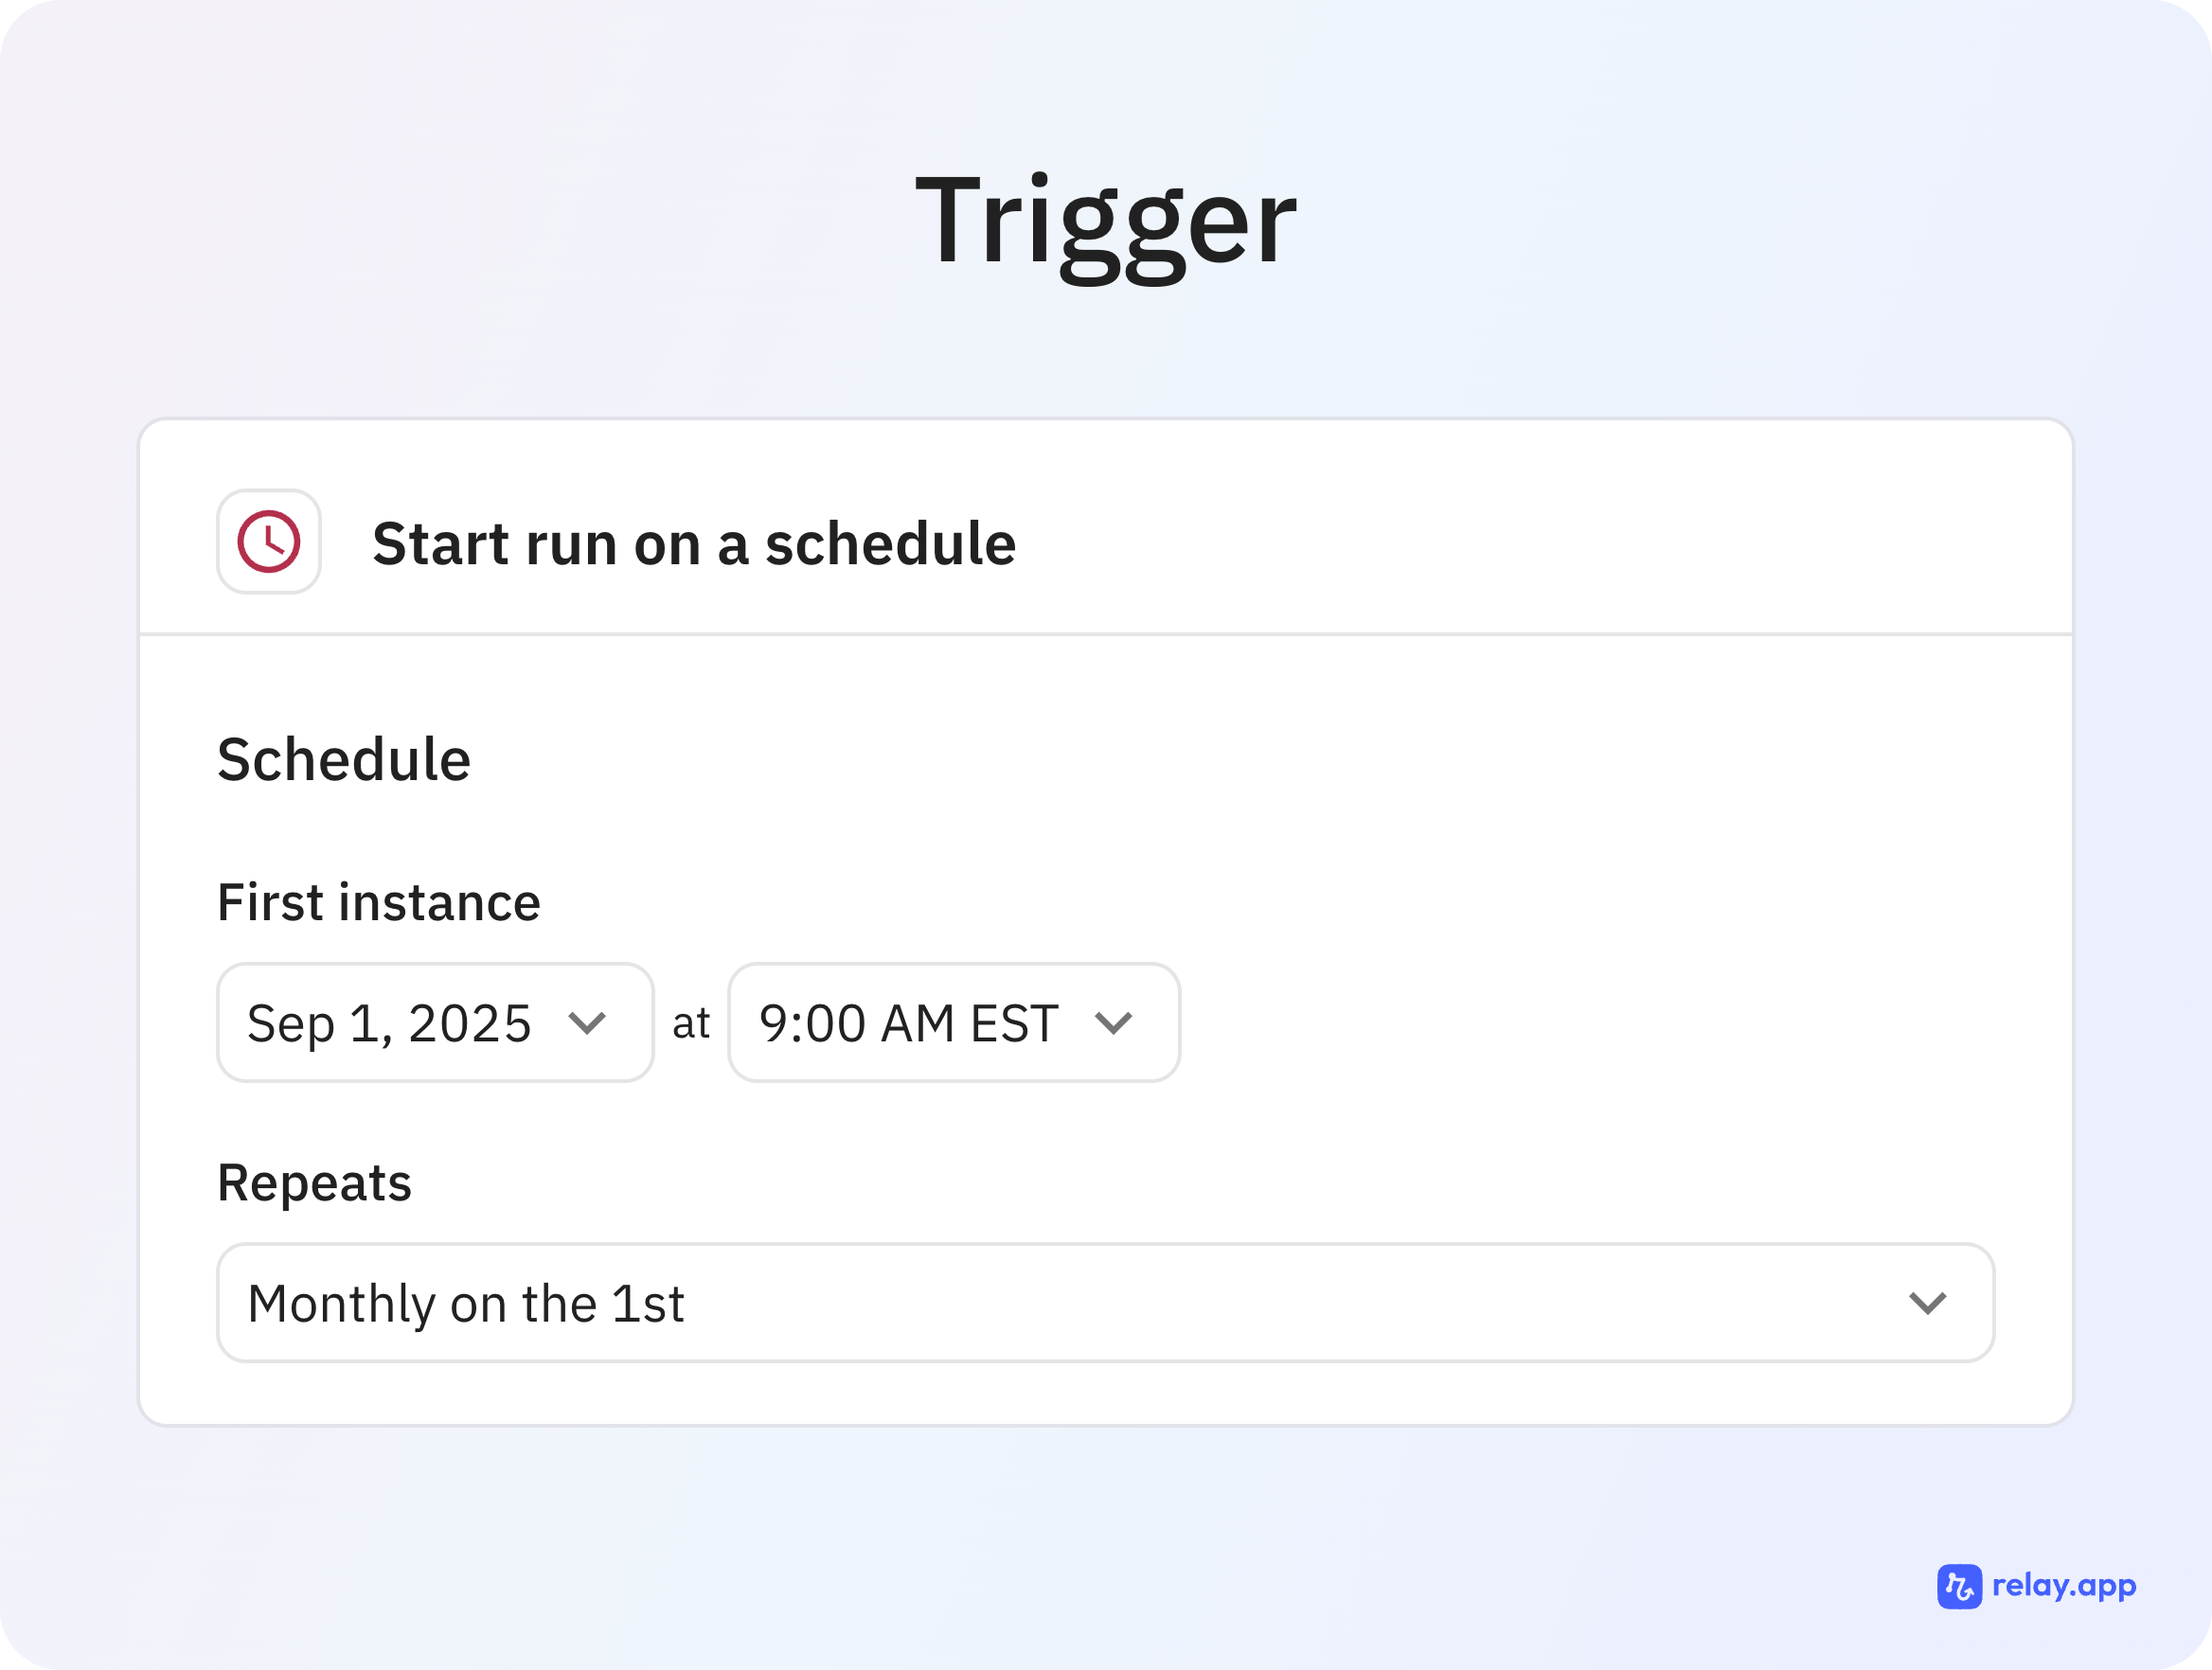
‼️ Note: Make sure that the Download schedule for this report matches your scheduled trigger for the AI workflow (ideally the report is downloaded a day before the workflow triggers).
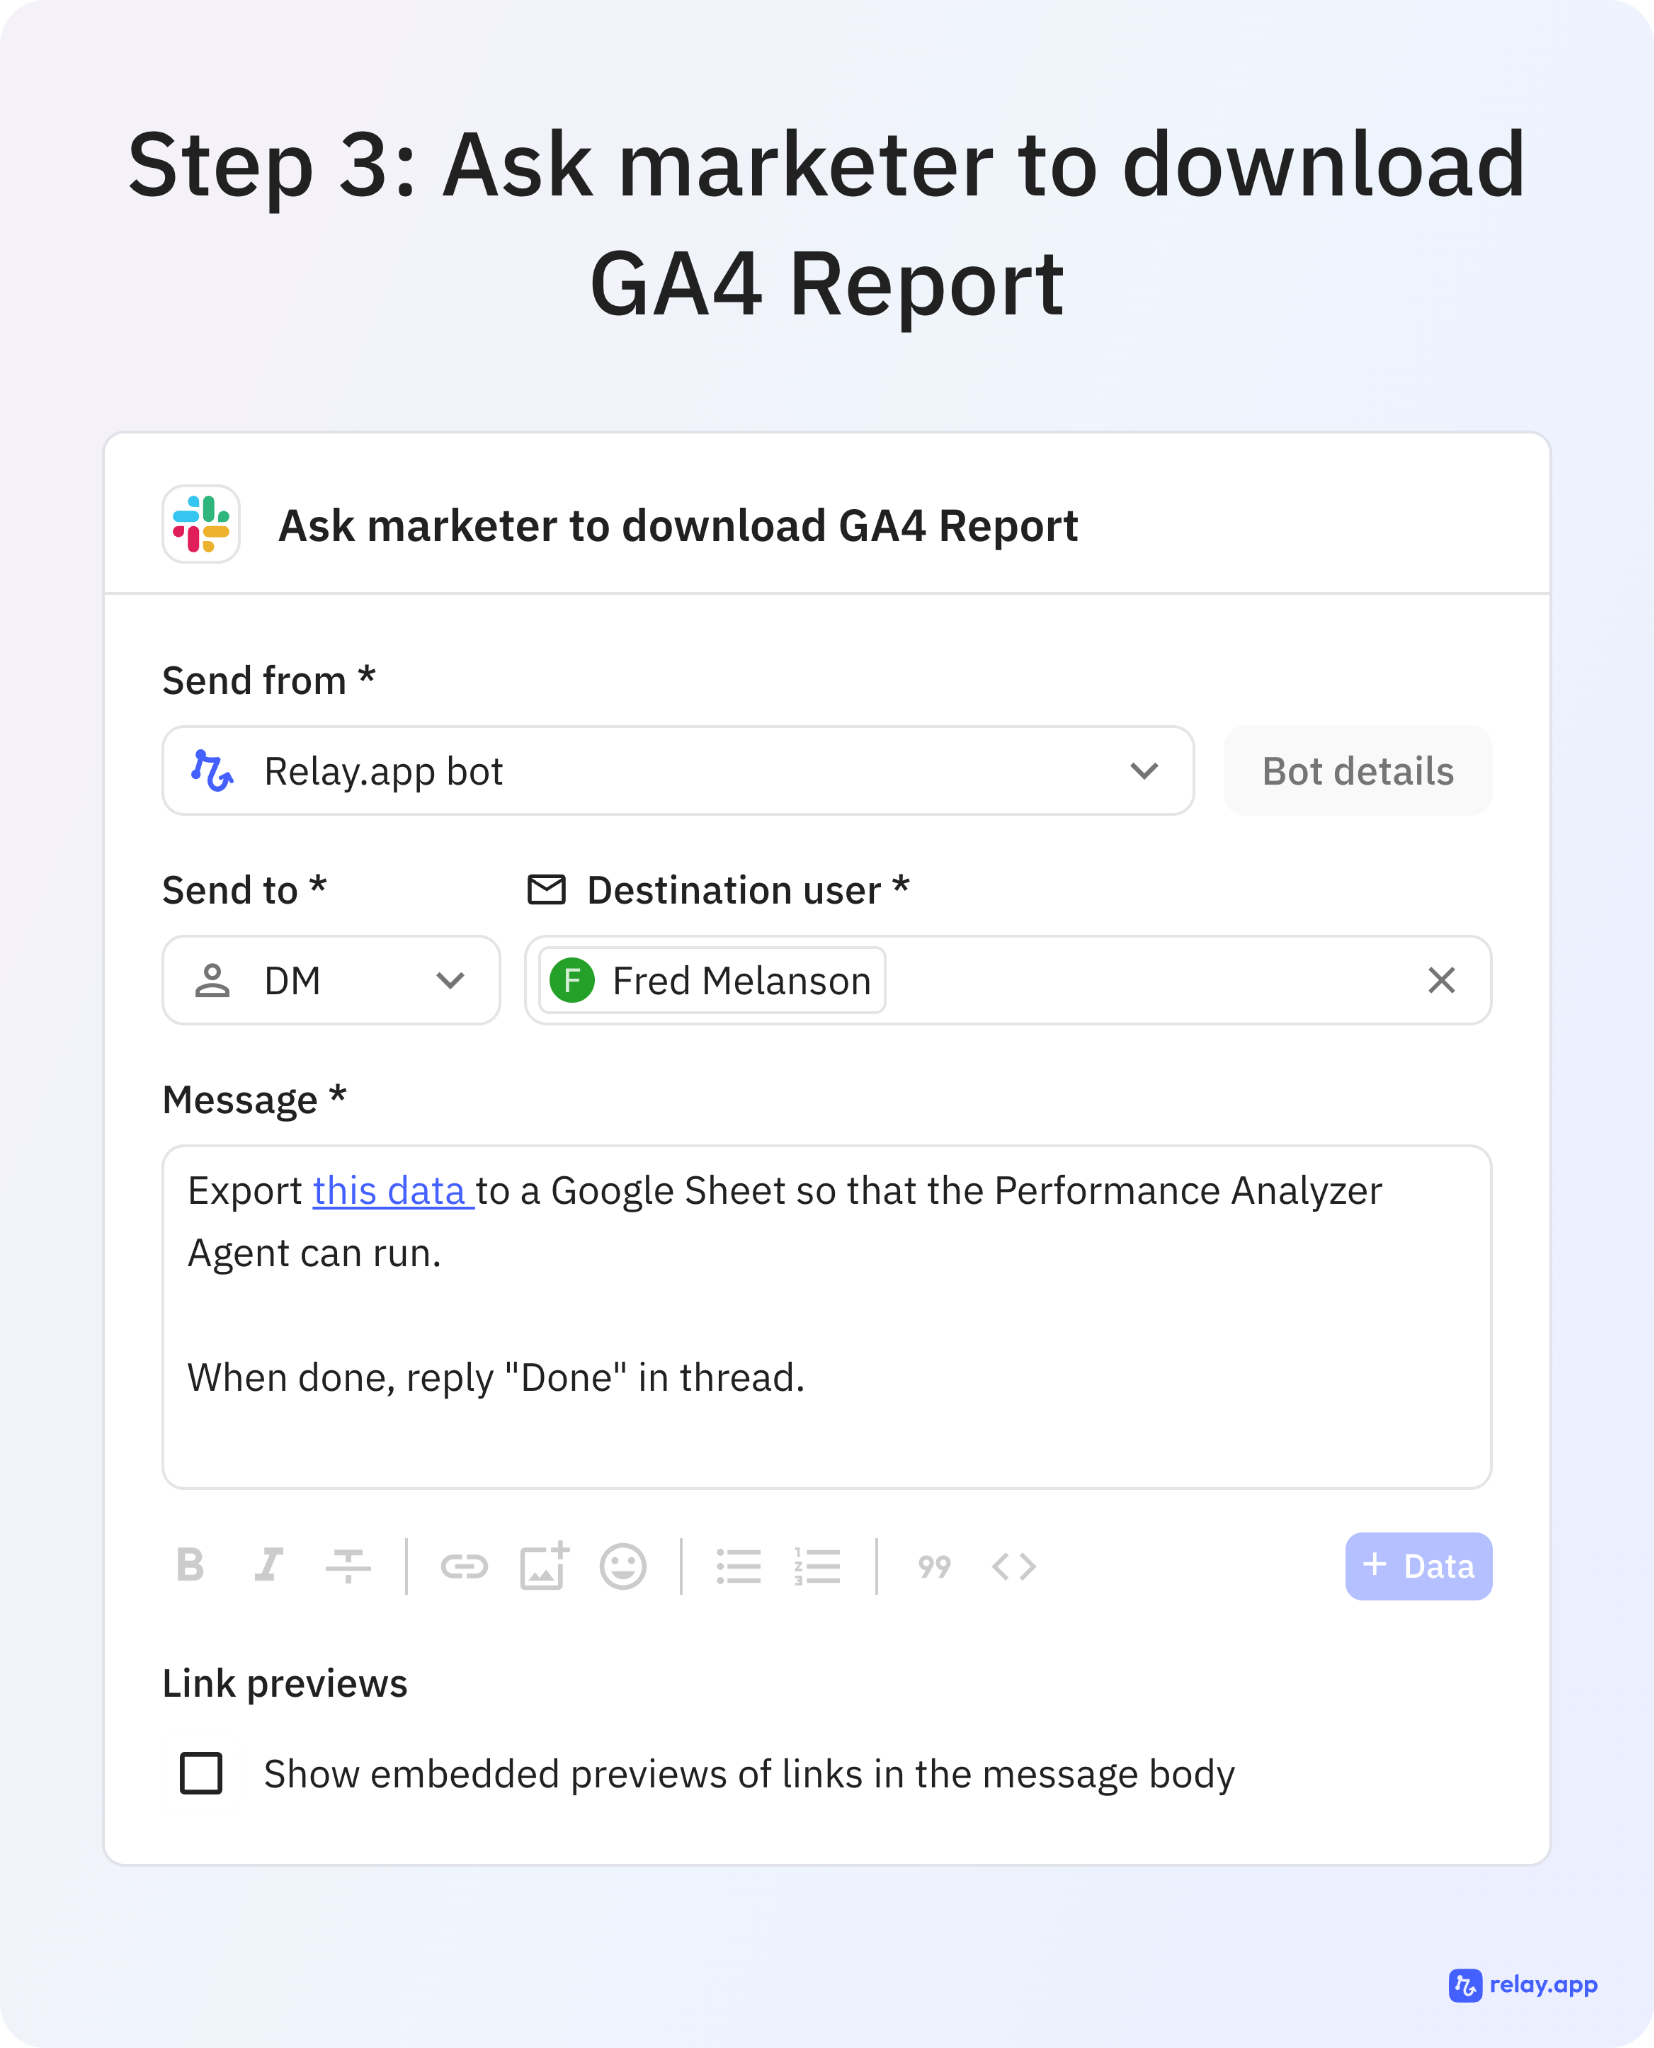
‼️ Note: This type of report cannot be automatically generated on a schedule. A human will need to create it once, save it, and then manually download it once this workflow has been triggered monthly.
Click the + next to “Dimensions” and import these:
✅ Once selected, click Import.
Click the + next to “Metrics” and import these:
✅ Then click Import.
In the Tab Settings (right panel):
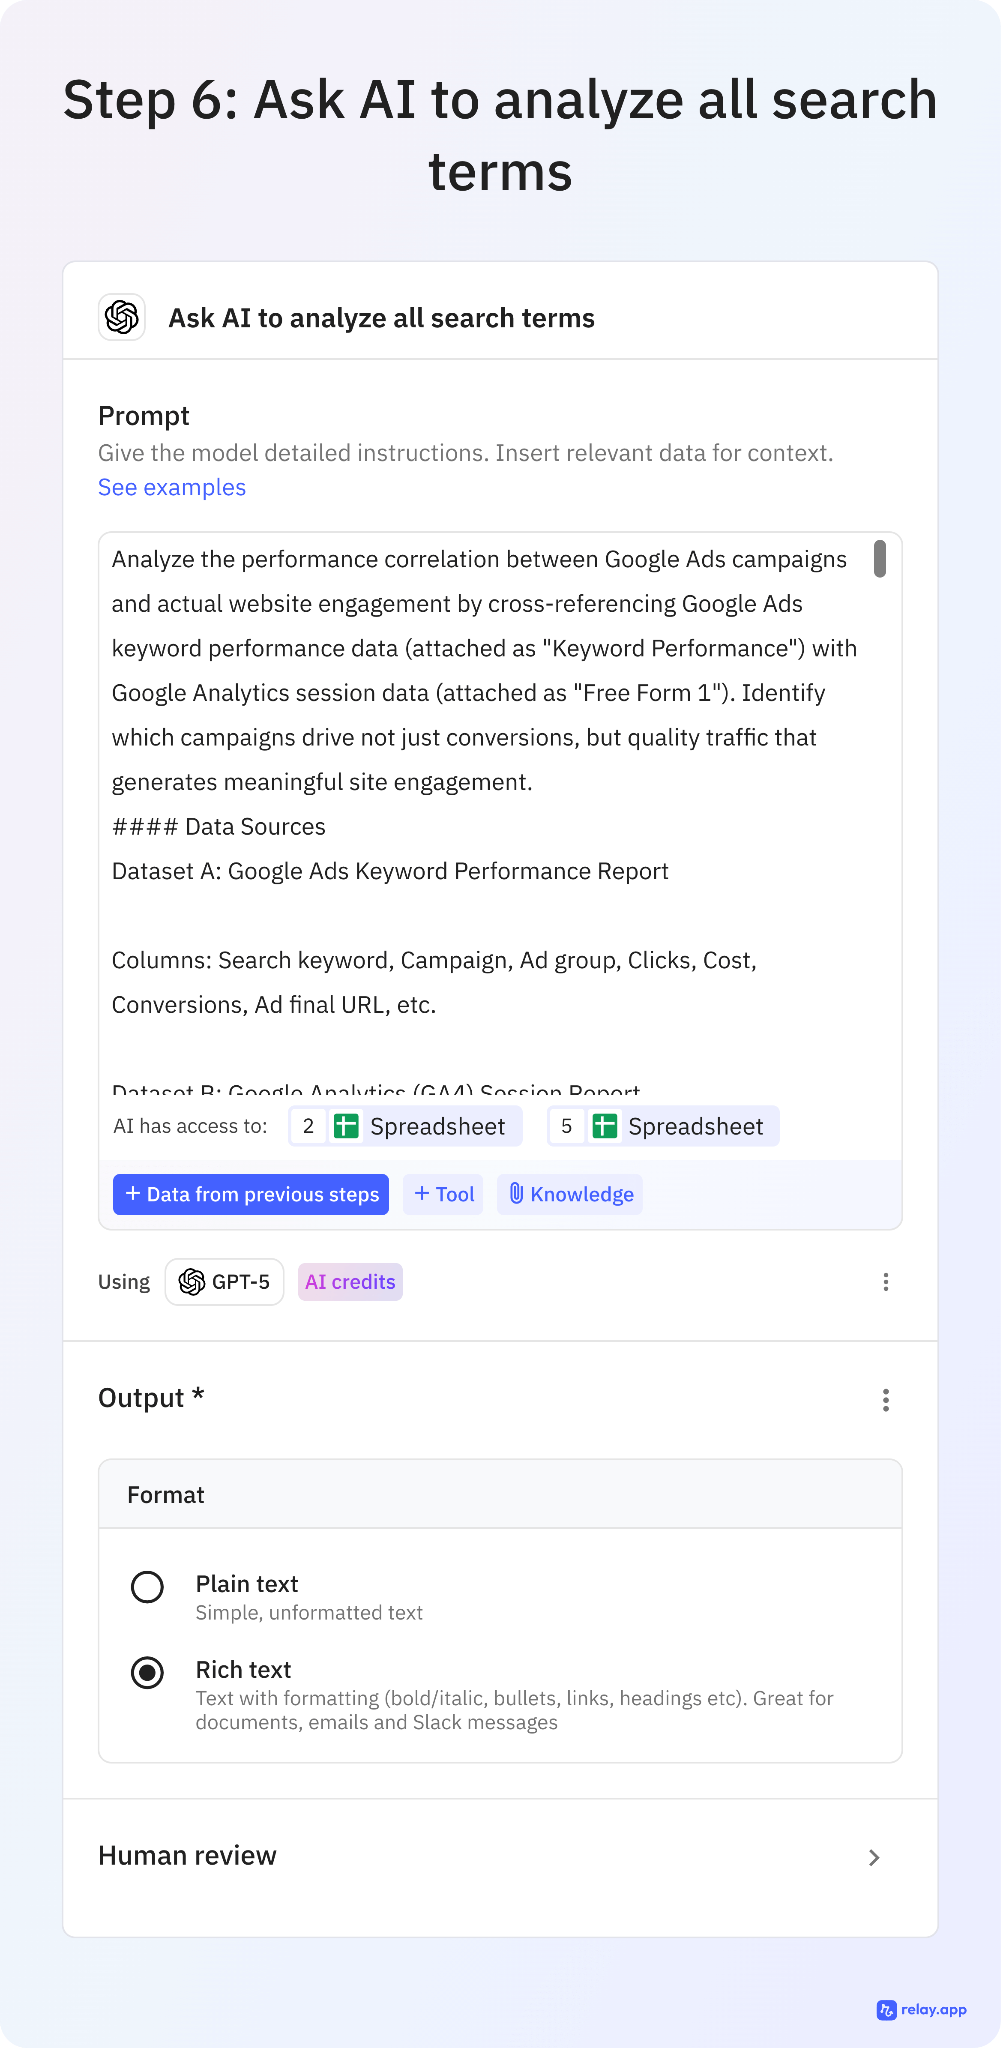
Prompt:
Analyze the performance correlation between Google Ads campaigns and actual website engagement by cross-referencing Google Ads keyword performance data (attached as "Keyword Performance") with Google Analytics session data (attached as "Free Form 1"). Identify which campaigns drive not just conversions, but quality traffic that generates meaningful site engagement.
#### Data Sources
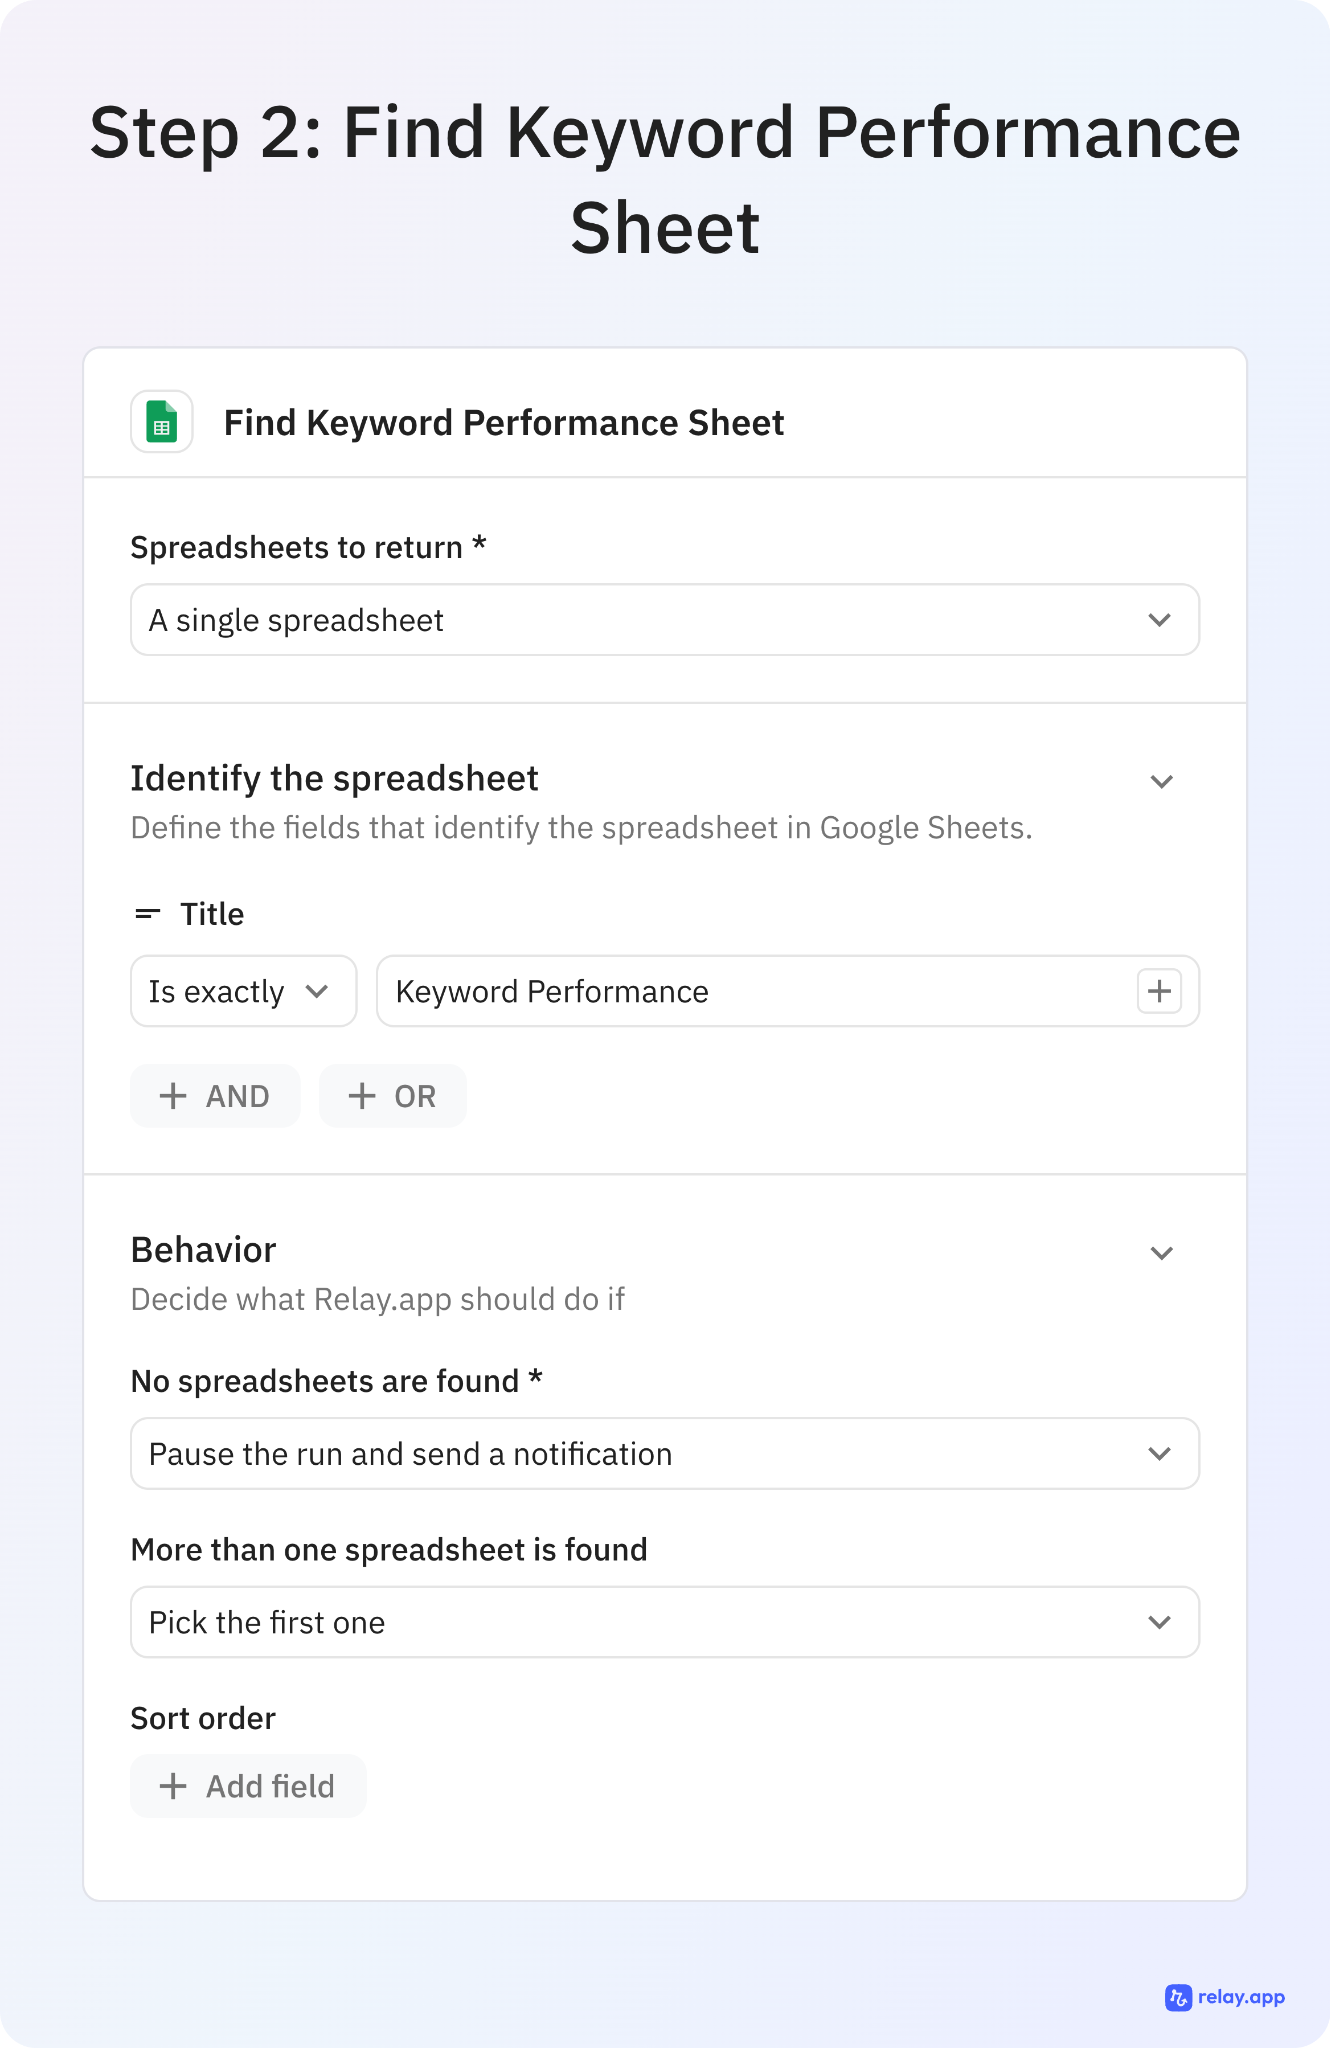
Dataset A: Google Ads Keyword Performance Report
Columns: Search keyword, Campaign, Ad group, Clicks, Cost, Conversions, Ad final URL, etc.
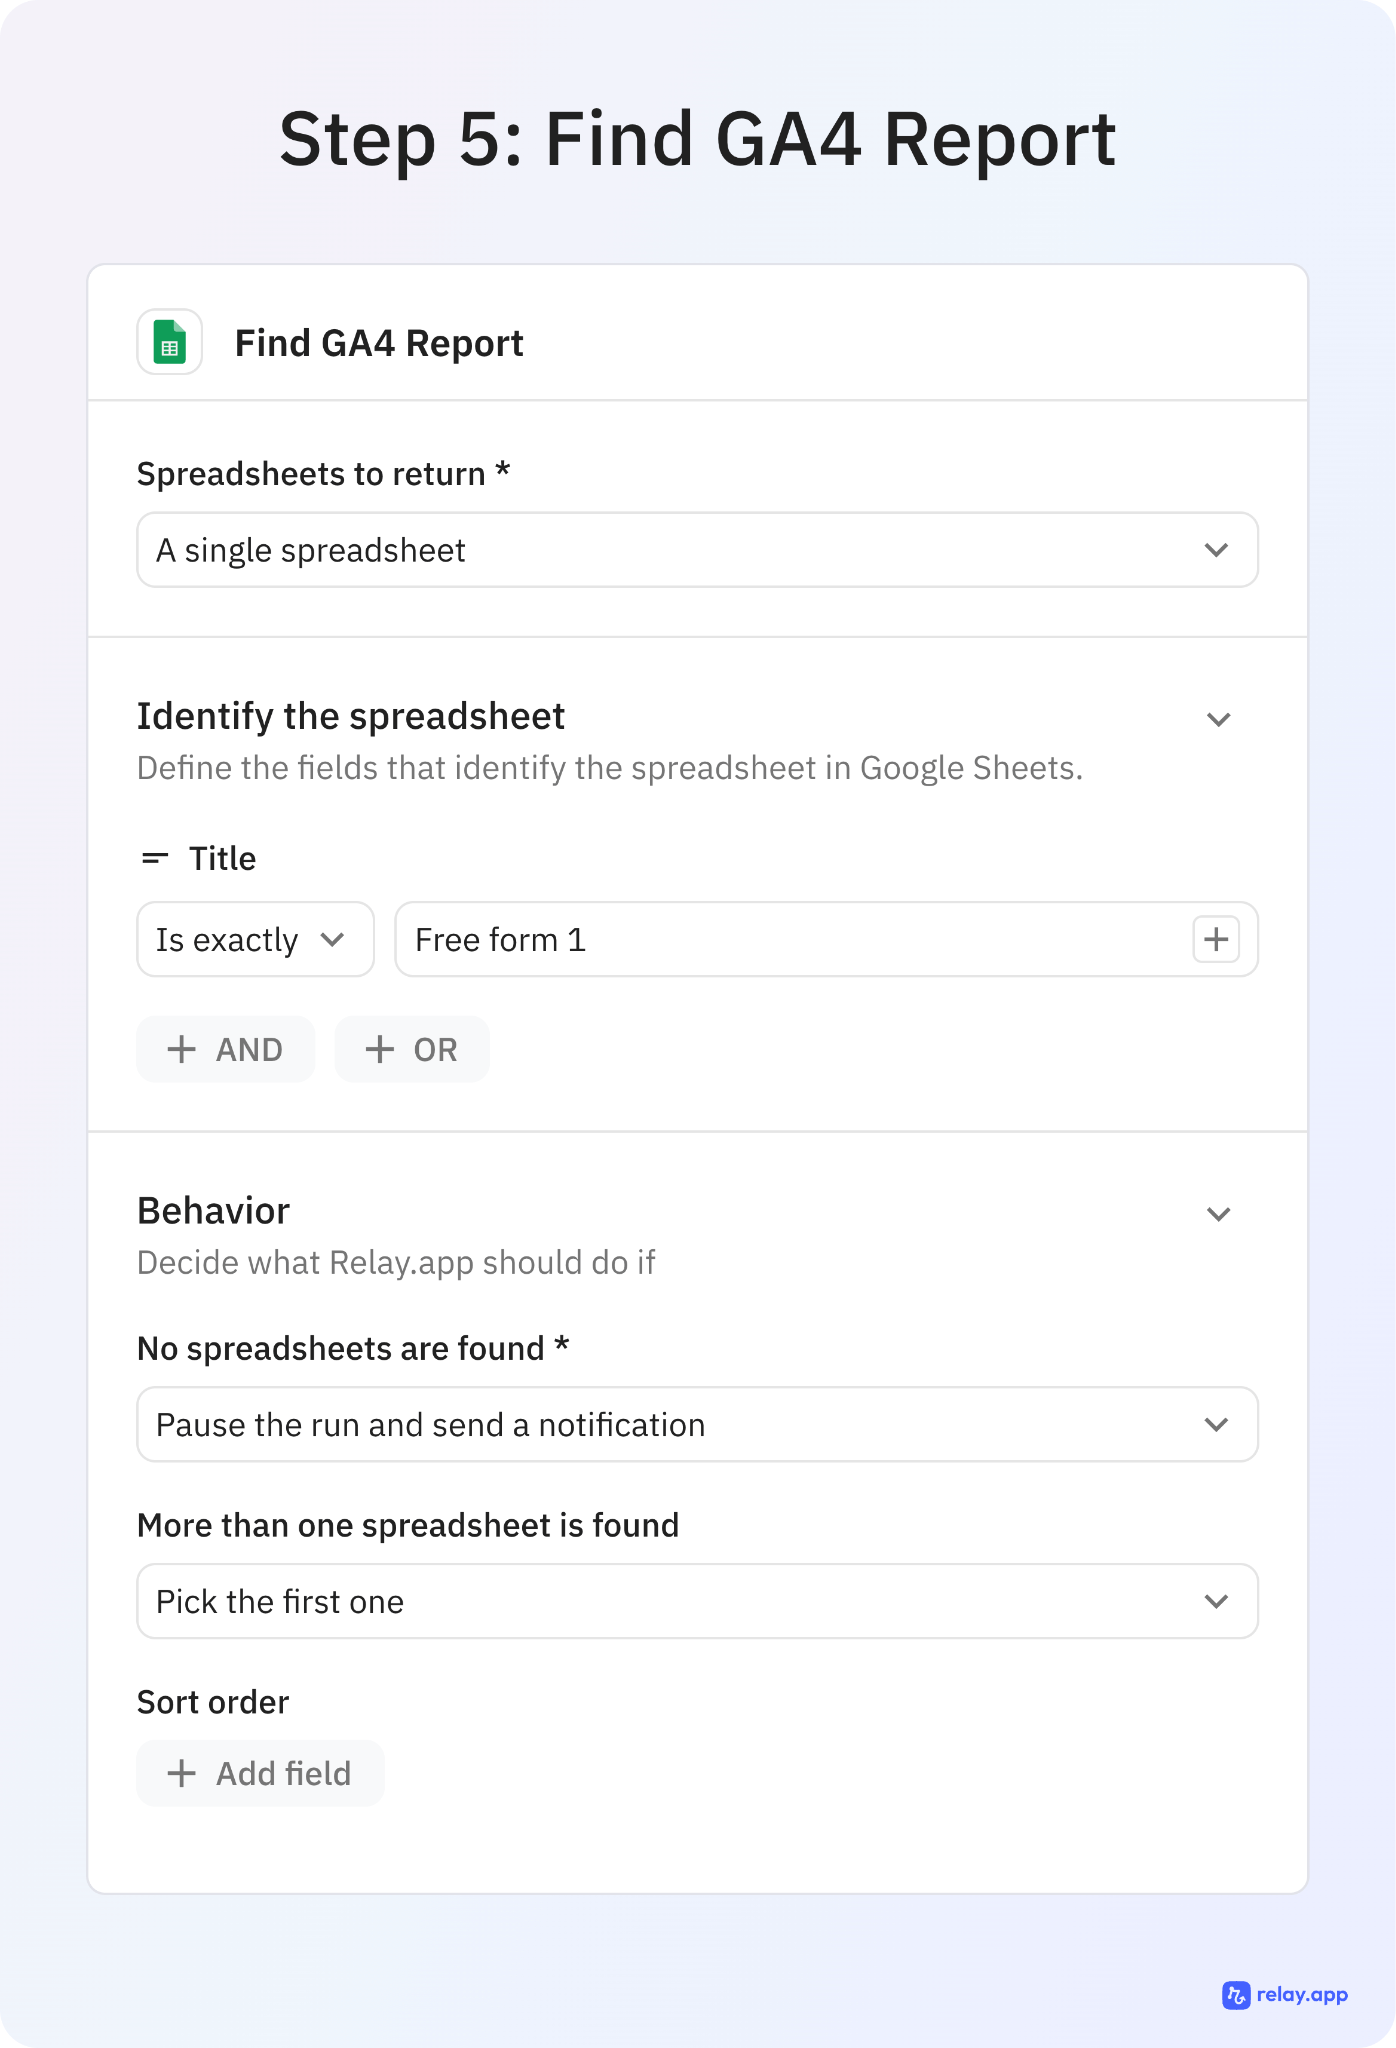
Dataset B: Google Analytics (GA4) Session Report
Columns: Session campaign, Session manual term, Landing page, Sessions, Engaged sessions, Average engagement time, Key events, etc.
#### Correlation Analysis Framework
1. UTM Parameter Correlation
Primary Matching Logic:
Extract UTM parameters from Google Ads "Ad final URL" column
Match utm_campaign with GA4 "Session campaign"
Match utm_term with GA4 "Session manual term"
Cross-reference campaign names between datasets
#### Analysis Points:
Which Google Ads campaigns have corresponding GA4 data?
What percentage of ad clicks translate to tracked GA4 sessions?
Identify campaigns with high click volume but low session tracking
2. Time-Based Correlation Analysis
Temporal Matching:
Compare Google Ads click patterns by date with GA4 session patterns
Identify days with high ad spend but low site engagement
Analyze click-to-session conversion rates over time
Flag unusual discrepancies between clicks and sessions
Look For:
Days with high Google Ads activity but low GA4 sessions (potential tracking issues)
Correlation between ad spend timing and engagement quality
Seasonal patterns in campaign effectiveness
3. Landing Page Performance Analysis
URL Matching Strategy:
Match Google Ads "Ad final URL" with GA4 "Landing page"
Strip UTM parameters to identify base landing pages
Analyze which landing pages convert ad traffic to engaged sessions
Performance Indicators:
Landing pages with high ad traffic but poor engagement metrics
Pages that excel at converting paid traffic to engaged users
Bounce rate patterns by landing page from paid traffic
4. Campaign Quality Assessment
High-Performing Campaigns (Identify campaigns that:
Generate high click volume AND high engaged session rates
Have reasonable cost-per-engaged-session ratios
Drive sessions with above-average engagement time
Convert to meaningful key events/goals
Underperforming Campaigns (Flag campaigns that:
Have high ad spend but low corresponding GA4 activity
Generate clicks but poor engagement metrics (high bounce rate, low session duration)
Show disconnect between conversion tracking and actual site behavior
Cost significantly more per engaged session than average
5. Keyword-Level Insights
Quality Traffic Keywords:
Keywords driving engaged sessions with reasonable cost
Search terms that correlate with high-value site behavior
Keywords with strong click-to-engaged-session conversion rates
Problematic Keywords:
High-cost keywords with poor engagement correlation
Keywords that generate clicks but immediate bounces
Search terms with conversion tracking but no corresponding GA4 activity
6. Traffic Pattern Analysis
Overall Correlation Health:
What percentage of Google Ads clicks show up as GA4 sessions?
Average engagement time for paid traffic vs. organic
Key event conversion rates for paid vs. other traffic sources
Optimization Opportunities:
Campaigns ready for budget increases (high engagement, reasonable cost)
Keywords/campaigns needing negative keyword additions
Landing page optimization priorities based on paid traffic performance
#### Analysis Output Requirements
Executive Summary (Concise)
Provide a clear assessment of overall Google Ads to GA4 correlation quality and campaign performance ranking.
#### Detailed Findings
Top 3 Best Performing Campaigns: High engagement + reasonable cost
Top 3 Underperforming Campaigns: Poor engagement relative to spend
Data Quality Issues: Missing correlations, tracking gaps, discrepancies
Budget Reallocation Opportunities: Specific spend shift recommendations
#### Actionable Recommendations
Specific campaigns to increase/decrease budgets
Keywords to add as negatives
Landing pages needing optimization
Tracking implementation improvements needed
#### Supporting Data
Correlation success rates by campaign
Cost-per-engaged-session calculations
Click-to-session conversion rates
Engagement quality scores by traffic source
#### Data Processing Instructions
Handle Missing Data Gracefully: When exact UTM matching fails, use campaign name similarity matching
Account for Tracking Delays: Allow ±1 day buffer for time-based correlations
Calculate Derived Metrics: Create engagement efficiency scores combining cost, clicks, sessions, and engagement time
Flag Data Quality Issues: Identify campaigns with suspiciously low correlation rates
Provide Confidence Scores: Rate each correlation as High/Medium/Low confidence based on data completeness
#### Critical Analysis Questions
Which campaigns show strong ad performance but weak site engagement?
Are there high-engagement campaigns that deserve more budget allocation?
What percentage of ad spend correlates to meaningful site activity?
Which keywords drive quality traffic beyond just conversions?
Are there tracking gaps that need immediate attention?
What landing page optimizations would improve paid traffic conversion?
Format the analysis as an executive report with clear recommendations, supporting data, and specific next steps for campaign optimization. Make it concise and easily readable. Assume the reader to be a marketign lead with context on the campaigns.